This web page was produced as an assignment for Genetics 677, an undergraduate course at UW-Madison.
What is phylogeny?
Phylogeny shows evolutionary relationships by comparing DNA/protein sequences. Phylogeny is displayed in phylogenetic trees (like a ancestral family tree) which shows which organism (with that DNA/protein sequence) is most closely related.
Gene Phylogeny Analysis
Gene sequences from 5 vertebrate homologs were aligned using various algorithms including: T-coffee, MUSCLE, and ClustalW2. These gene sequence alignments were then used to construct phylogenetic trees using T-coffee, GeneBee, MUSCLE, and ClustalW2. The trees show how the homolog gene sequences, which are conserved to some degree with the human HLA-C gene sequence, are related.
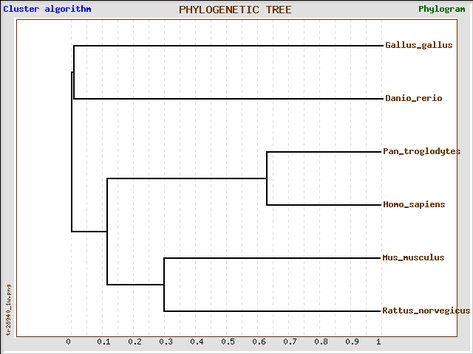
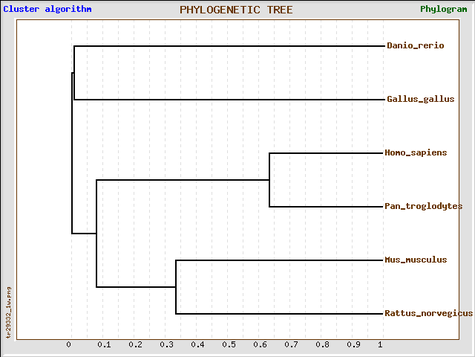
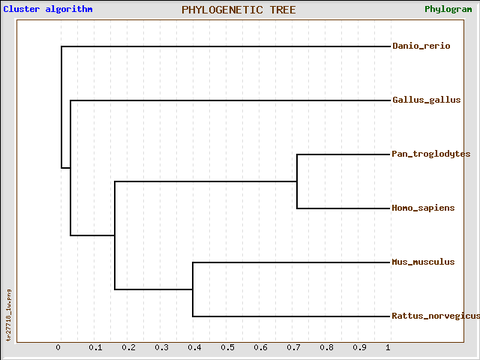
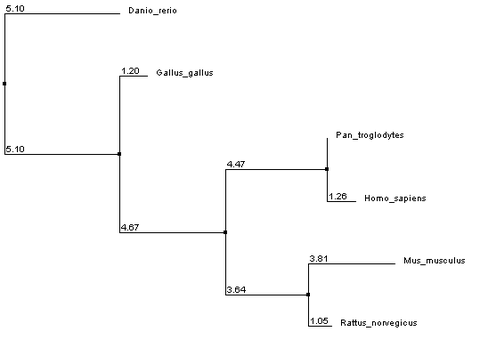
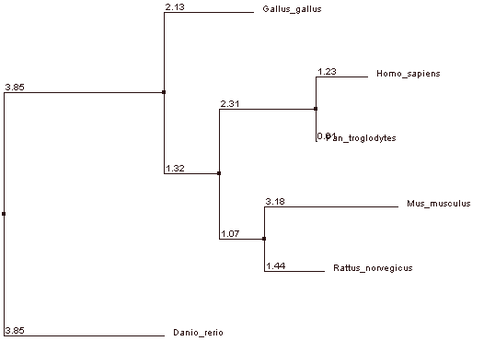
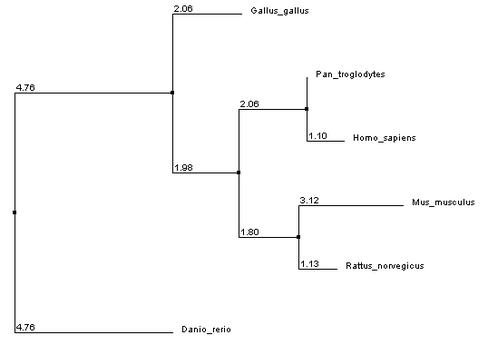
The human and chimpanzee have the most closely related gene sequence, followed by the rat and mouse, being the next related gene sequences. The chicken and the zebrafish have the least conservation.
All 6 gene phylogeny trees were nearly identical, omitting the distances. The one difference shown in two trees (in the GeneBee ClustalW2 alignment and T-coffee alignment) suggests that the zebrafish and the chicken are equally related to the 4 other homologs, including the human protein sequence. Whereas, the 4 other trees show that the zebrafish protein sequence is the least related, making the chicken's protein sequence more similar to the humans. It is difficult to say which tree, method of analysis that is, is more accurate; however, comparing the gene phylogeny to the protein phylogeny suggests that the zebrafish is a more distant relative, referring only to the HLA-C gene/protein.
Gene Phylogeny
GeneBee (ClustalW2 alignment)
Phylogeny tree
constructed with GeneBee.
Sequence alignment data (using ClustalW2) can be visualized here .
Parameters: Pairwise Alignment Options: Protein Weight Matrix: BLOSUM
Multiple Sequence Alignment Options: Protein Weight Matrix: BLOSUM
constructed with GeneBee.
Sequence alignment data (using ClustalW2) can be visualized here .
Parameters: Pairwise Alignment Options: Protein Weight Matrix: BLOSUM
Multiple Sequence Alignment Options: Protein Weight Matrix: BLOSUM
GeneBee (T-coffee alignment)
Phylogeny tree constructed with GeneBee.
Sequence alignment data was conducted using T-Coffee. This data can be visualized here.
Sequence alignment data was conducted using T-Coffee. This data can be visualized here.
GeneBee (MUSCLE alignment)
Phylogeny tree constructed with GeneBee.
Sequence alignment data was conducted using MUSCLE. This data can be visualized here.
Sequence alignment data was conducted using MUSCLE. This data can be visualized here.
ClustalW2
ClustalW2 was used to to construct the phylogeny tree while using Neighbor Joining % Identity with distances.
Sequence alignment data (using ClustalW2) can be visualized here .
Parameters: Pairwise Alignment Options: Protein Weight Matrix: BLOSUM
Multiple Sequence Alignment Options: Protein Weight Matrix: BLOSUM
Sequence alignment data (using ClustalW2) can be visualized here .
Parameters: Pairwise Alignment Options: Protein Weight Matrix: BLOSUM
Multiple Sequence Alignment Options: Protein Weight Matrix: BLOSUM
T-Coffee
Phylogeny tree and sequence alignment data was conducted using T-Coffee. This data can be visualized here.
MUSCLE
References
Site created by Valeri Lapacek
Genetics 677 Assignment, Spring 2012
University of Wisconsin-Madison
Last Updated: 5/23/2012
Genetics 677 Assignment, Spring 2012
University of Wisconsin-Madison
Last Updated: 5/23/2012
